Tipping Point

Declining economic growth may become too much for equity markets to ignore

Photo by Michał Parzuchowski on Unsplash

Written October 2, 2019

Yesterday’s sharp deterioration in risk sentiment is a sign that the equity market and its patrons at the Fed may have a couple of serious problems: 1) The latest numbers from the Institute for Supply Management (ISM) suggests the US economy may be close to, or already in recession and 2) the Fed has been too slow to recognize it. Neither of these issues is exactly new news but the stock market’s seemingly oblivious reaction to the growing danger has been nothing short of remarkable. Until now.

The continued erosion of benchmark ISM survey data on U.S. manufacturing, its worst reading since 2009, was punctuated by a complete collapse in the forward-looking new export orders component. See https://bloom.bg/2oWfXgK. The disruption in commerce and global supply chains from trade wars is real and intensifying. Similarly, contractionary readings on factory production from China and Europe this week only added to the recessionary drumbeat.

It is undeniable that the Fed underestimated the deceleration in the economy. Their hesitancy to ease when signs of economic weakness first appeared earlier this year probably means that a recession is now inevitable. They missed the boat. Even if the Fed cut rates aggressively now it may not matter. And that possibility is starting to occur to investors who had come to rely on the Fed as a consistent backstop for asset prices.

It feels like the markets are at a tipping point. The major central banks have spent a decade throwing trillions at the economy and have little to show for it except for unprecedented levels of income inequality. But it hasn’t stopped them from pressing forward with more of the same policies. The renewed race to the bottom on interest rates is becoming less effective while at the same time increasingly desperate.

The failed WeWork IPO might have rung the proverbial bell in this era of easy money and stretched valuations. Fundamentals matter. Earnings, which they clearly don’t have, matter. Like Pets.com, the poster child of absurdity from an earlier bubble, WeWork will go down as an example of “what were they thinking?” for years to come. See https://bit.ly/2nE1y8N.

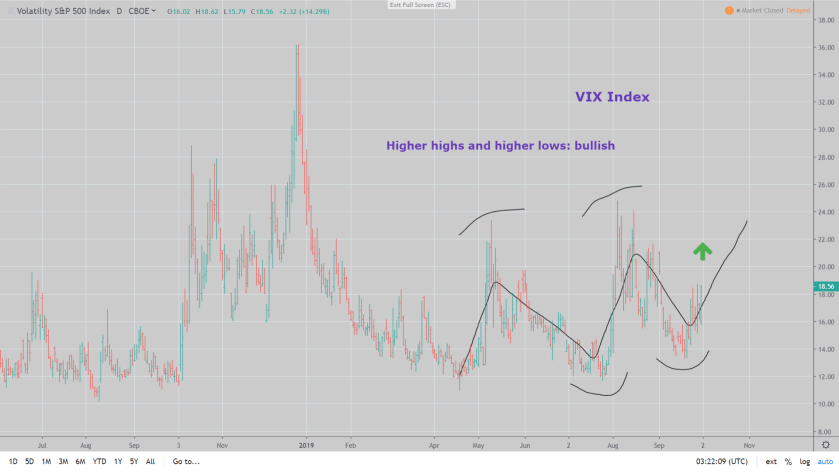
As I noted in my two previous pieces (see VIX Cheap as Impeachment Threat Grows and Liquidity Trumps Fundamentals), the most obvious trades in this shifting paradigm are to be long volatility and long the front-end rate market. Historically, October is more volatile than most other months. And the lurch lower in key economic data points could be the catalyst that makes volatility in equities, bonds, and FX all suddenly appear to be ridiculously underpriced.

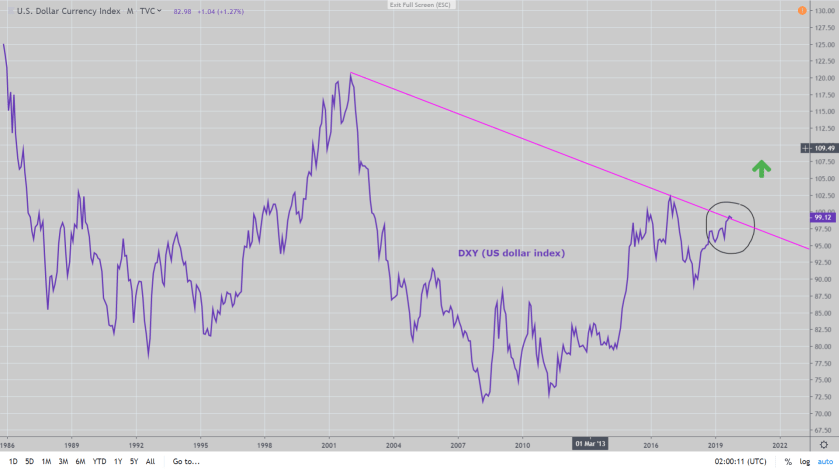
Furthermore, anyone who doubts that the Fed could take rates back to zero, and quickly, has not looked at the U.S. dollar. The growing global dollar shortage, which we’ve written about extensively, is pushing the buck up through multi-decade resistance (see Fed Rate Cut: Too Little, Too Late). The long term dollar index (DXY) chart is very bullish, and if the USD gets legs it will make the 2018 emerging market selloff look tame by comparison. The Fed can’t afford for that to happen and will be forced to keep cutting rates to try to prevent it.

US dollar index (DXY). Breaking out higher.
Emerging market ETF (EEM). Look out below. A stronger USD leaves this sector very vulnerable.
CBOE volatility index (VIX). Cheap and bullish.

China’s Slowdown Could Mean Big Trouble For Base Metals

Industrial commodities stand on a deflationary cliff edge

Photo by Екатерина Александрова from Pexels

Written September 19, 2019

China’s quasi-capitalist system, where the communist party still retains a degree of control over the economy, leaves the true state of affairs subject to a certain amount of suspicion.  Is the economic data accurate or is it just what they want us to see?

Which is why many investors rely heavily on proxies for Chinese activity to more accurately determine the state of play in their economy.  Base metals widely used in construction and manufacturing, such as copper, steel and iron ore have well-deserved reputations as gauges of economic trends.  They are also all freely traded on financial exchanges, where price discovery and transparency allow them to be used as a check against official statistics put out by the state.

With the exception of oil and gas, China is the world’s largest consumer of most commodities.  According to data compiled by The Visual Capitalist’s Jeff Desjardins, China imports half or more of the world’s production of nickel, copper, and steel (as well as cement and coal), so any changes in behavior in China will have a meaningful impact on prices of those commodities. See https://bit.ly/2KPz9nZ.

Chinese growth has been steadily declining for the past year and a half.  The latest GDP reading for the second quarter of 2019 at 6.2% was the weakest result in twenty-seven years.  For experienced China watchers, 6% has long been considered something of a line in the sand as a minimum level of growth required to keep a sufficient number of people employed and to avoid any dissent against the government from taking root.  Two events this past week suggest that point may soon be at hand.

Underscoring the urgency of the situation, Chinese premier Li Keqiang admitted that it is becoming “very difficult” for China to maintain that crucial 6% growth rate. See https://reut.rs/2lTmjvV.  He must have been tipped off because just 24 hours later it was revealed that in August China’s industrial output fell to a rate of only 4.4%, its weakest showing in 17 years.  And that was before the latest round of trade tariffs were imposed. See https://bit.ly/2lVzL2g.

Not surprisingly, this slowing in growth is weighing on prices in the base metals sector as well as across the commodities complex in general.  One look at a chart of either copper or the broader CRB index shows that like the Chinese economy, commodities are approaching cliff edges of their own (see below).

Legendary trader Raoul Pal calls the current price pattern of the CRB index the most dangerous chart in the world, worrying that a break lower would be a sign of complete deflationary breakdown. China might be the center of this storm but it will have global implications for consumers and policymakers alike. A dire prediction for sure. As forward-looking indicators of this possibility, investors ignore the action in the base metal sector at their peril.

Copper
CRB Core Commodities Index

Markets Hit the Panic Button

May 29, 2019

It’s already been a big week for red flags in the bond market after the Fed’s most reliable recession indicator, an inversion in the US Treasury 3 month-10 year spread, led a rush to the safe havens of sovereign debt. See https://bit.ly/2BRqa4l . Yields are down everywhere, even hitting record lows in both Australia and New Zealand as negative effects of slowing growth and the US-China trade war intensifies and broadens. Globally almost $13 trillion of bonds now trade at a negative yield, meaning you have to pay the issuer for the privilege of owning them. Nuts, but a sign that investors are becoming more concerned with the return of capital rather than the return on capital. See https://bit.ly/2Wd91M1 .

The panic is starting to spread to the equity and credit sectors as two of the markets’ worst fears come into view. As we have noted repeatedly here, the possibility of 1) a higher dollar and/or 2) corporate credit downgrades remain the greatest threats for 2019 because of the destructive potential that both outcomes hold for a global financial system leveraged up on dollar debt. See “Rates Headed South for the Summer” and “Time to BBBe Careful“. These are the pain trades that central banks will find hard to mitigate and action in the bond markets is telling investors that they should indeed be worried.

.The benchmark 10yr Treasury yield and the S&P. Stocks ‘catching down’ to the message from the bond market.

This Time Might be Different

May 13, 2019

Amid the back-and-forth of retaliatory trade tariffs between the U.S. and China are some important tells in price action that indicate the situation has moved beyond bluster and snark into a more protracted standoff with negative implications for global growth. Any inclination to think that this too will soon blow over, like previous disputes in the negotiating process, should be checked against the breakdown in commodity prices and treasury bond yields as well as macroeconomic risk benchmarks like the Australian dollar and the Chinese yuan. We warned about this possibility one month ago in What’s wrong with this picture. Both currencies are now perched on a cliff edge (see chart below.) As a proxy for the general global condition, the Aussie dollar’s plight is particularly concerning.

China and the U.S. appear squaring off for a harder fight. Trump clearly sees toughness on trade to be a winning issue for his 2020 election campaign. With an increasingly dovish Fed as his insurance policy against harm to the economy or equity markets, previous assumptions that the president had been bluffing a weak hand or was too eager to cut a deal with the Chinese are proving wrong.

Trump’s aggressive posture is backing Chinese leadership into a corner. One reason blamed for the collapse in talks late last week was China’s demand that the text of any agreement is “balanced,” reflecting respect for its sovereign “dignity.” (https://reut.rs/2JgYqZF ) Those are loaded terms that mean different things to different people. But the need for saving face in many cultures can’t be overstated and the insertion of feelings into the equation now makes any potential deal significantly more difficult to achieve. Investors are right to worry that this sharp-elbows approach on trade by the U.S. will also draw similar reactions when it comes time to negotiate with the Japanese or the Europeans.

Markets are on the edge of a paradigm shift. The FX, commodity, and bond sectors have been telling us for some time that the threat to global growth from disruptions in supply chains and to fixed investments due to changing terms on trade are more pervasive and may be longer lasting than many forecasts currently assume. Volatility is waking up as doubts emerge over central bankers’ ability to counter these headwinds with traditional monetary policy. It’s a massive red flag and a sign that risk may be underpriced. Despite that, the temptation to buy weakness in this ten-year-old equity bull market is both instinctive and strong. But if FX (especially AUD and/or CNH) starts to break lower from here, this time will almost certainly be different.

Australian dollar/Japanese yen cross (AUD/JPY). A reliable FX risk proxy, on the cliff edge.
US dollar vs offshore Chinese yuan (USD/CNH). A break above 7.00 would be a major deflationary and risk-negative event.