The Biggest Trade in the World

Photo by Vance Osterhout on Unsplash

The largest position in the history of the financial markets is about to get squeezed.

Written April 27th, 2020

Successful traders are always asking themselves two questions in the course of analyzing markets: 1) given a set of known inputs, are markets behaving as expected? and 2) if not, why not?

Since the COVID-19 pandemic crashed the world’s financial markets last month, central banks have responded with extraordinary measures to stabilize markets and prop up their respective economies.

For its part, the Fed has undertaken policies on a scale unprecedented in the history of finance, radically expanding their balance sheet and going so far as lending directly to municipalities and buying junk bond ETFs in the open market. Essentially printing money, but on steroids.

The equity markets have responded favorably, much as one would expect given the deluge of liquidity. It’s a reflexive response conditioned by a decade of the Fed propping up asset prices every time the markets stumbled. Will it last? Nobody knows.

However, the part of this scenario that is not going according to plan is potentially the most consequential for the financial markets. The US dollar needs to weaken. Big time. For a global economy staring at a tsunami of deflation, it is the most critical element to achieving a durable reflation of commodities and equity prices and restoring confidence in many regions of the world, especially the emerging markets.

This is not lost on central bank officials. In fact, if you were asked to come up with a policy to destroy your own currency, moves by the Fed and the Treasury over the past month to explode the federal deficit would be it.

The speculative trading community initially took the cue. According to CFTC data, the specs began shorting the dollar in the middle of March as rates went to zero and the money printing presses began working overtime.

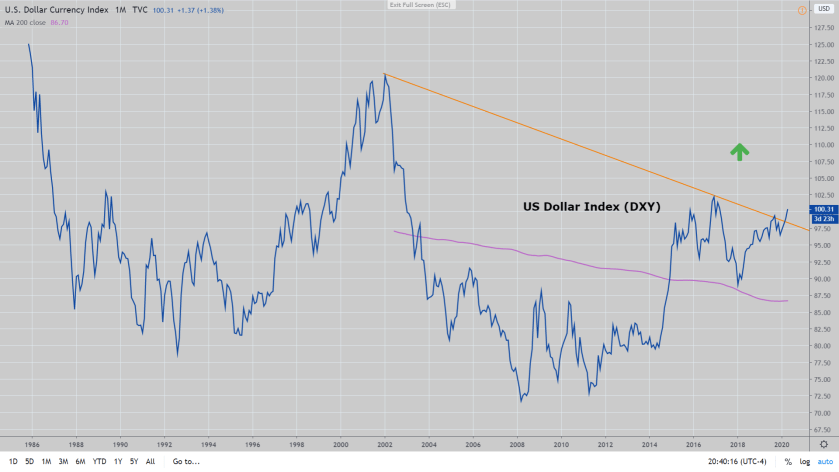
But since then, not only hasn’t the dollar gone down, it is higher instead.

The latest study by the Bank for International Settlements estimates the world’s short position in the dollar at about $13 trillion, much of it based on dollar debt held by offshore banks and corporations, representing the largest aggregate position in the financial markets by far.

Currency swap facilities instituted and expanded by the Federal Reserve with the intention of ensuring these entities access to dollar funding helped settle the markets late last month, but the currency’s appreciation since then is a sure sign that it won’t be enough. For many of these foreign corporations, swap lines are of little value if their respective central banks don’t have sufficient reserves to swap or US Treasury securities to pledge as collateral.

Also, printing trillions won’t do much good if there is no turnover, or velocity, of that money due to the collapse in business activity. It just ends up in the vaults of institutions that don’t need it, crowding out the weaker borrowers.

Against all expectations, the steady grind higher in the dollar in recent weeks is a red flag that this massive short trade is about to get squeezed.

The implications will be felt everywhere. The risk to the broader economy is that a stronger dollar triggers a doom loop of debt deflation, where slower global growth causes the dollar to rise and a stronger dollar, in turn, depresses prices and causes growth to slow.

As we’ve been recommending for more than a year, stick with long positions in the dollar and front-end treasuries. In our last piece “The L-Shaped Recovery“, we suggested adding physical gold and taking advantage of near-term strength in equities to reduce exposure. If the dollar starts to accelerate, things could get ugly. Quickly. And despite the Fed’s insistence on not taking interest rates negative, it’s not impossible that this will end up being their next move.

US Dollar Index (DXY)

China’s Slowdown Could Mean Big Trouble For Base Metals

Industrial commodities stand on a deflationary cliff edge

Photo by Екатерина Александрова from Pexels

Written September 19, 2019

China’s quasi-capitalist system, where the communist party still retains a degree of control over the economy, leaves the true state of affairs subject to a certain amount of suspicion.  Is the economic data accurate or is it just what they want us to see?

Which is why many investors rely heavily on proxies for Chinese activity to more accurately determine the state of play in their economy.  Base metals widely used in construction and manufacturing, such as copper, steel and iron ore have well-deserved reputations as gauges of economic trends.  They are also all freely traded on financial exchanges, where price discovery and transparency allow them to be used as a check against official statistics put out by the state.

With the exception of oil and gas, China is the world’s largest consumer of most commodities.  According to data compiled by The Visual Capitalist’s Jeff Desjardins, China imports half or more of the world’s production of nickel, copper, and steel (as well as cement and coal), so any changes in behavior in China will have a meaningful impact on prices of those commodities. See https://bit.ly/2KPz9nZ.

Chinese growth has been steadily declining for the past year and a half.  The latest GDP reading for the second quarter of 2019 at 6.2% was the weakest result in twenty-seven years.  For experienced China watchers, 6% has long been considered something of a line in the sand as a minimum level of growth required to keep a sufficient number of people employed and to avoid any dissent against the government from taking root.  Two events this past week suggest that point may soon be at hand.

Underscoring the urgency of the situation, Chinese premier Li Keqiang admitted that it is becoming “very difficult” for China to maintain that crucial 6% growth rate. See https://reut.rs/2lTmjvV.  He must have been tipped off because just 24 hours later it was revealed that in August China’s industrial output fell to a rate of only 4.4%, its weakest showing in 17 years.  And that was before the latest round of trade tariffs were imposed. See https://bit.ly/2lVzL2g.

Not surprisingly, this slowing in growth is weighing on prices in the base metals sector as well as across the commodities complex in general.  One look at a chart of either copper or the broader CRB index shows that like the Chinese economy, commodities are approaching cliff edges of their own (see below).

Legendary trader Raoul Pal calls the current price pattern of the CRB index the most dangerous chart in the world, worrying that a break lower would be a sign of complete deflationary breakdown. China might be the center of this storm but it will have global implications for consumers and policymakers alike. A dire prediction for sure. As forward-looking indicators of this possibility, investors ignore the action in the base metal sector at their peril.

Copper
CRB Core Commodities Index

Bonds and Commodities are the Unwanted Guests at the Equity Party

Bond yields and commodity prices see a much different outcome than stocks.

June 10, 2019

Have you noticed that issues the Fed cares about are conditional and dependent on whether the stock market is going up or down? When the market is rising things like trade wars and weak price trends, while worthy of mention, are still considered “transitory” events. More annoying than scary. On the other hand, when the market is falling these same factors are considered full-blown threats to the economy.

Market action in the month of May and the Fed’s response is a good example of the latter. Even though the S&P had dropped nearly 8% from all-time highs, it was still up 9% on the year when Fed chairman Powell hit the panic button on June 4 saying the Fed was ready to act “as appropriate” to counter growing protectionist threats to the economy. See https://cnb.cx/2WaWNi5. Wink, wink. That’s all the markets needed to hear to launch six straight days of vertical ascent. Forget about why the Fed might be considering rate cuts: collapsing inflation expectations, potentially impaired corporate earnings or deteriorating credit, the fact that they are is all that matters. The playbook for equities remains the same as it has for the past decade: the bad news is (still) good news. As renown economist John Maynard Keynes once said, “the market can stay irrational longer than you can stay solvent”. So true.

But several reliable macroeconomic benchmarks don’t seem to be playing along. While stocks rip higher, bond yields and prices for copper and oil have barely budged off their lows. It appears that the economic outlook projected by the fixed income and commodity sectors is quite a bit less optimistic than what is expected in the equity space. The conflicting message between these two worlds might be temporary and meaningless or it could be something worth paying attention to.

At some point, the marginal utility of repeated deployments of the Fed put will begin to decline. I have no idea if that time is near but subtle market divergences like these will be the first sign that the game may be over. Therefore I will be paying attention.

Two diverging outcomes: the S&P and 10yr Yields

Things Will Get Worse Before They Get Better…

The Strike Price on the Fed Put is A Lot Lower Than You Think

June 4, 2019

For anyone doubting the severity of the economic impact triggered by an escalating trade war, take a look at the ongoing collapse in the commodities and short term interest rate sectors. The CRB Index is on its way to getting flushed and Fed Funds futures are pricing in the possibility of four full rate cuts over the next 18 months. Any hope that investors had that tariffs and supply chain disruptions were just temporary inconveniences is now out the window.

The fundamental narrative is beginning to catch up to what the rate complex has been screaming for months. A report Monday showed US manufacturing activity slowed to the weakest pace in two years. See https://reut.rs/317v4m3 . In addition, the JP Morgan Global Manufacturing Purchasing Manager’s Index (PMI) posted its worst result since 2012, indicating an outright contraction in worldwide factory production. See https://bit.ly/2WiNqBS. But these are lagging indicators. It will get worse.

St. Louis Fed president Jim Bullard is the first voting member of the FOMC to break ranks with his colleagues, saying yesterday that “signals from the Treasury yield curve seem to suggest that the current policy rate setting is inappropriately high.” See https://cnb.cx/2WCogO8 . Most of the board probably agrees with him but given their history of decision-making don’t know how they’re now going to explain rate cuts with a 3.6% unemployment rate.

Herein lies the problem for the equity and credit markets. This last leg down feels like investors are beginning to suspect that the willingness of the Fed to deploy a safety net under the stock market, as they have in the past, is now a much bigger ask. The economy is decelerating quickly but it’s hard to sell that story given the ongoing strength in employment. There will have to be more pain. In other words, the proverbial Fed put is still in play but this time around it might come with a much lower strike price.

Commodities in big trouble
Interest rates collapsing

FX Set to Tighten Screws on Dollar Debtors

May 31,2019

The US dollar yesterday closed at new highs for 2019, and at its best level in two years. It remains a safe haven destination in times of declining global growth and a weak investment climate made worse by seemingly unending trade disputes. The most recent move to impose tariffs on Mexican imports is proof that President Trump is not shy about using this tactic to advance policy. See https://reut.rs/2HLiYYc . Who would be surprised if Europe wasn’t the next target? If this is to be the new normal, traders are quickly coming to realize that many markets are not priced for it.

Two questions here are, can the dollar go higher and what is the impact? The answers are 1) yes and 2) not good.

FX, by nature, is all relative. Outside of the Swiss franc and the Japanese yen which also provide safe havens, there aren’t many currencies that you’d rather own than the dollar right now. Fundamentally, a 2% yield, deep liquidity, and a growing economy look pretty good compared to the mess in most other regions of the world. And export-dependent blocs like Asia-Pacific, Europe, and Latin America really have no choice but to weaken their own currencies to compensate for the hit to their economies from reduced trade.

Technically, the price action in the dollar is extremely bullish. In the short-term, the dollar index (DXY) continues to advance in a positive pattern of higher highs and higher lows. The long-term setup could see the DXY back at the 2002 highs, more than 20% higher from here.

The downside of dollar strength is that it’s likely to accompany, and even thrive on stress in the financial markets. The big dump in commodities benchmarks like copper and oil this week are signs that investors see this coming and are hunkering down. As we’ve written here before, the Achilles heel of the broader marketplace is the credit sector. See “Time to BBBe Careful .” A higher USD would squeeze leveraged dollar debtors, including many banking systems abroad, who are massively and negatively exposed. With half of the investment grade bond market rated BBB and hovering just one notch above junk status, a move up in the dollar could be the trigger that sets those dominoes falling and makes a credit meltdown our next black swan event.

Us Dollar Index
%d bloggers like this: